


What is this?
This project takes a local library of music that is tagged and will predict the emotion of the song of either happy or sad. This data can then be passed to a visualiser which will play the selected song along with five other recommended songs based off its emotional position on a valence energy plane.
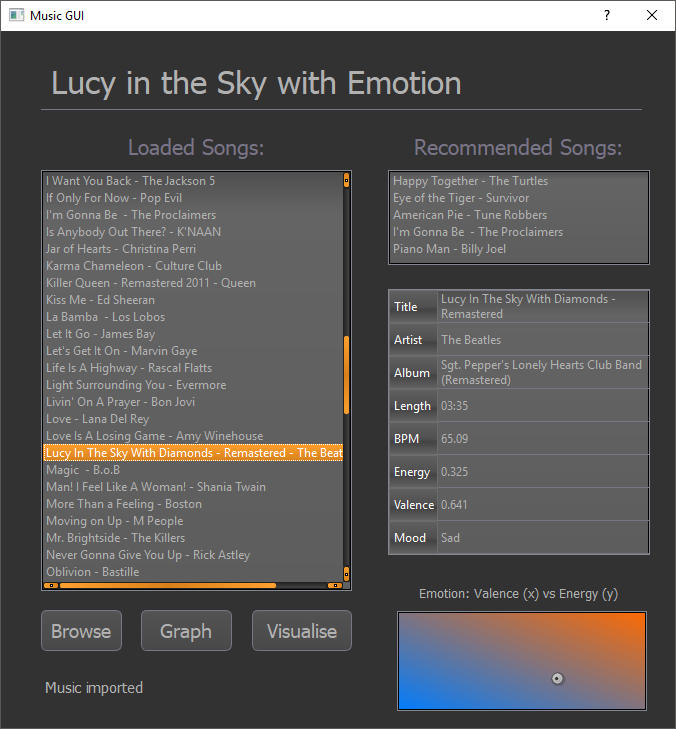
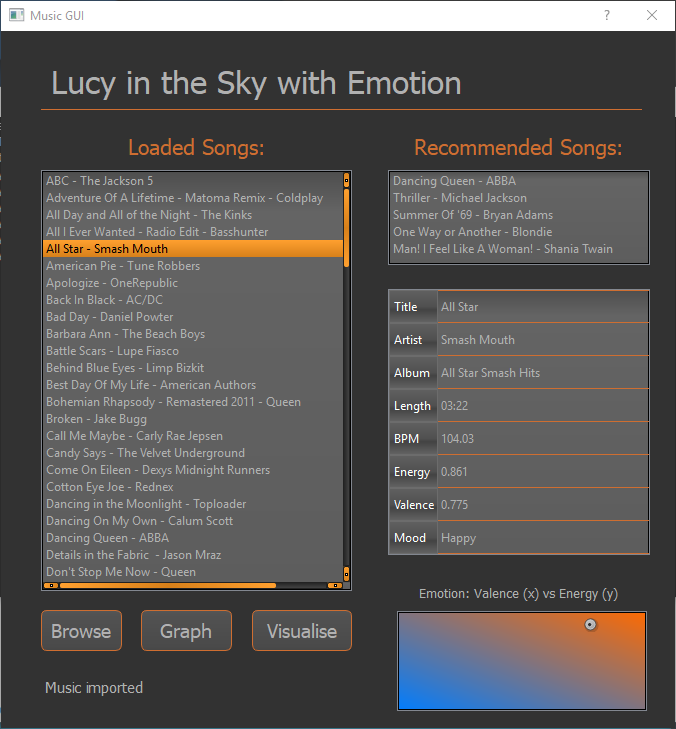
When the project is first started it will create a sklearn.neighbors.KNeighborsClassifier instance and be provided previously researched data for points to be compared to later. The Browse button then needs to be clicked and a directory selected. The music library is then scraped for tags and searches for them in Spotify. We then get audio data from Spotify for each song (if possible) and present the data on the GUI. When a user clicks on a song, recommendations of the five nearest songs based on emotion, song data and the point on the emotion gradient are all displayed to the user. When the user clicks the Visualise button, data will be sent to the visualiser and started.
Demonstration and Screenshots
GUI - Emotion Detection
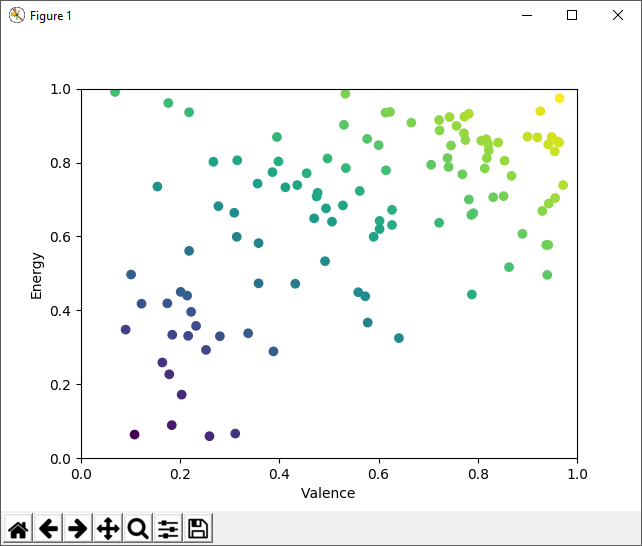
GUI - Valence Energy Graph
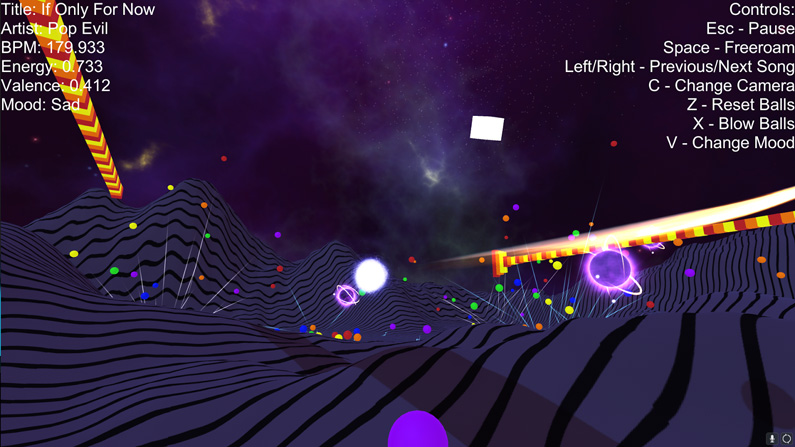
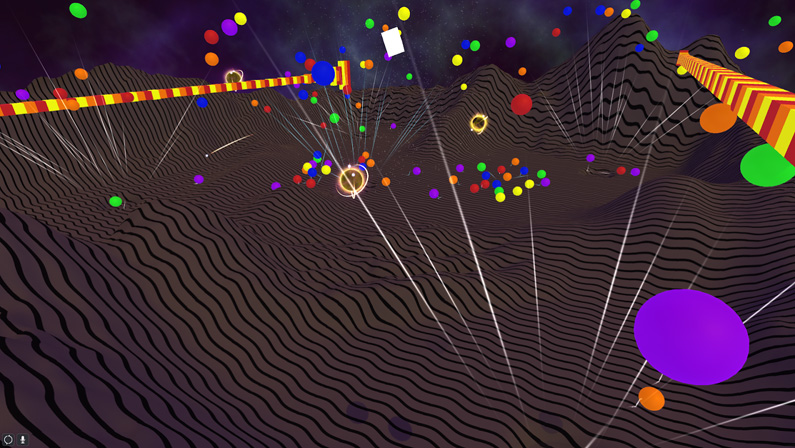
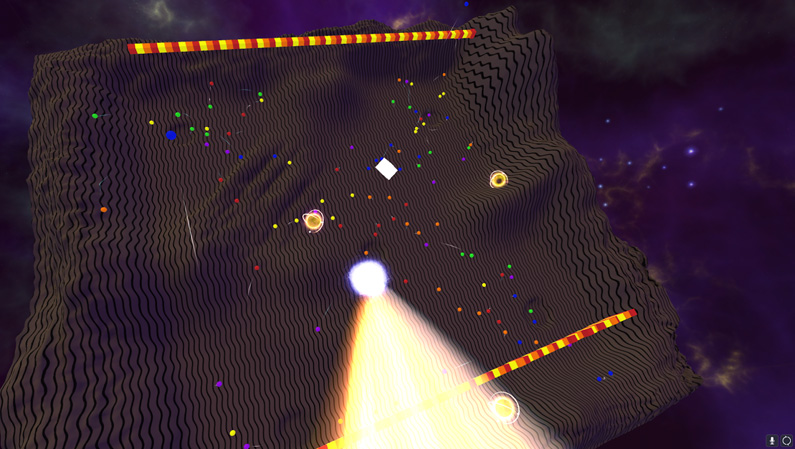
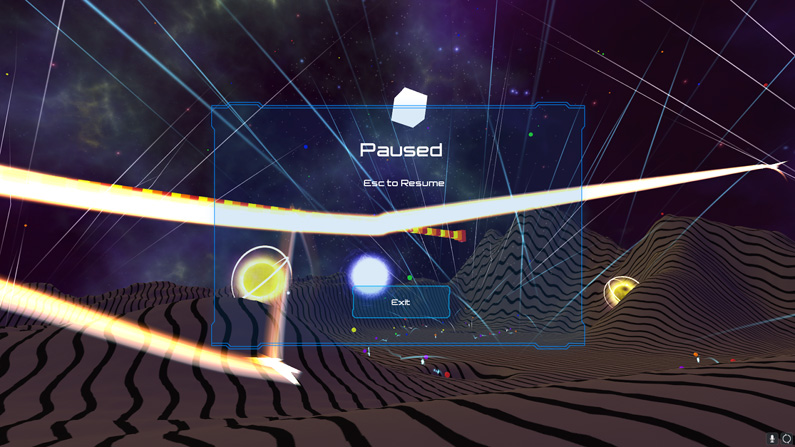
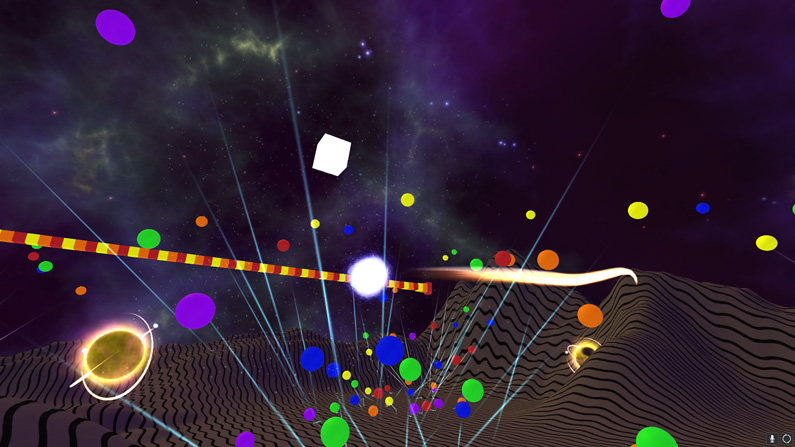
Visualiser
Installation and Setup
- First clone the repository at https://github.com/brentvollebregt/Lucy-In-The-Sky-With-Emotion
- Install Python (tested with 3.5.2)
- If using Windows, run install_dependencies.bat. If not using windows, run the pip commands in the bat file. This will install most of the modules.
- Install scipy by first downloading it at https://www.lfd.uci.edu/~gohlke/pythonlibs/#scipy and then running
pip install [file] - Install numpy+mkl by first downloading it at https://www.lfd.uci.edu/~gohlke/pythonlibs/#numpy and then running
pip install [file] - Build the visualiser using Unity
- Edit the paths in main.py to link to the visualiser
- Lines 123 and 125 to the locations of the desired output (123 for song files and 125 for the CSV file)
- Line 156 to the executable to start the visualiser
- Read about the issues below
- Run main.py
Issues
Currently, the visualiser cannot take in dynamic input for audio. CSV files are still read in dynamically and will change based on what song is selected when the visualise button is clicked.
This means music that was used in the building of the visualiser will be the only audio that the visualiser plays, however the data that the visualiser reads from the CSV to manipulate some functions will still be used.
To temporarily fix this so incorrect data is not displayed can be easily fixed by commenting out lines 153 to 155 in main.py. This will disable the CSV wiring so the original CSV file will still be passing the correct data.
Usage
To start this project, open up the emotion recognition part of the project by running main.py with Python. When the GUI appears, click Browse and select a folder that contains .mp3 tagged files (doesn't have to be in the top directory).
The Graph button can be pressed to display the songs on the emotion plane (Energy vs Valence).
After you have selected a song you want to visualise, click the Visualise button. After a short moment, the visualiser will open and you will be promoted how you want to run it (speed and resolution).
When the visualiser has started, you can hold the left control key to display a list of the controls. These controls are:
- Esc - Pause
- Space - Freeroam the environment. Moves the ball off the pre-defined path.
- Left / Right Arrows - Previous / Next Song
- C - Change Camera
- Z - Reset Balls
- X - Blow balls away from the camera
- V - Change mood (for testing)