Introduction
I was recently discussing 'stupid' apps with a flatmate and how they do so well on app stores. We were thinking of really stupid apps and had come up with the idea of just changing the colour when a user tapped on the screen. Obviously, there would be more to the app but it seemed very achievable and something fun to make. My idea was to generate the colours as hexadecimal values and display them to the user along with the colour. I then thought about making the aim of the app to get all the colours; a user would randomly generate colours until they have gotten them all. With there being 16,777,216 different colours that can be represented using hexadecimal I noticed very quickly that this is very unachievable for a user, but how unachievable really was it?
Plan
My plan to finding how 'unachievable' the problem is, is to generate random numbers in a range until all individual numbers in that range are generated. This will be done a few times for certain ranges to get averages and then will be plotted to get a line of best fit. With this line of best fit, I should be able to predict ranges much larger than I will be testing with.
Creating An Initial Method
Sitting in my girlfriend's English lecture at Victoria University seemed like the best place to start this. The plan was to make a definition that took a range integer and randomly generates values until all values in the range were found. It would then return how many generations it took to get all values. To check when I had all values, I sorted the list using pythons built-in list sort and then checked if it was identical to a generated list containing 1 to the range in order which was created using the range function in list comprehension.
import random

def get_generation(r):
    aim = [i for i in range(1, r + 1)]
    generation_count = 0
    generated = []
    while True:
        gen = random.randint(1, r)
        generation_count += 1
        if gen not in generated:
            generated.append(gen)
            generated.sort()
            if generated == aim:
                break
    return generation_count

runs = 1000 # How many runs to get average
min_ = 10 # Start
max_ = 500 # End
step_ = 50 # Step

ranges_to_run = [i for i in range(min_, max_, step_)]
total = 0
for range_aim in ranges_to_run:
    for i in range(runs):
        total += get_generation(range_aim)

    print (range_aim, "\t", total/runs)
    total = 0
This script was clean and was easy to use; all I had to do was change the four runs, min_, max_ and step_ variables to change looping for average calculation and the integers tested.
Testing Small Numbers
Initially, this script was tested with 1000 runs, min_ of 10, max_ of 500 and a step_ of 50; the results are as follows.
| Range | Average Number Generations |
|---|---|
| 10 | 29.522 |
| 60 | 280.669 |
| 110 | 580.739 |
| 160 | 910.13 |
| 210 | 1264.651 |
| 260 | 1600.558 |
| 310 | 1960.173 |
| 360 | 2326.071 |
| 410 | 2710.593 |
| 460 | 3069.874 |
| 510 | 3477.14 |
| 560 | 3854.053 |
| 610 | 4283.64 |
| 660 | 4683.23 |
| 710 | 5121.04 |
| 760 | 5414.062 |
| 810 | 5865.353 |
| 860 | 6321.91 |
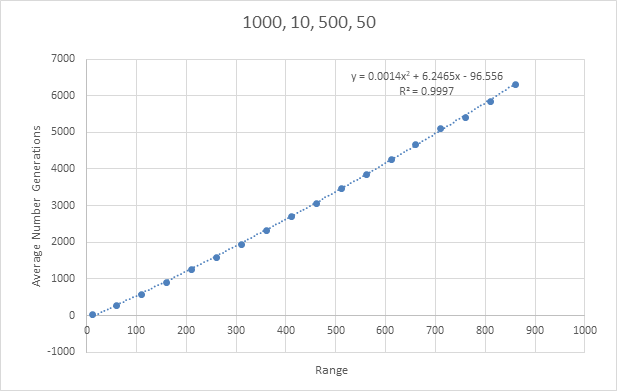
This data produced gives a clear pattern and produced a line of best fit with R^2 value of 0.9997 which is excellent. Using this equation to calculate the target value of 16,777,216 I got a value of 3.94x10^11. Even though this is a very large number, it doesn't seem like it is incorrect. There is a slight exponential addition to the equation calculated which will mean that little increases in x will give larger increases in y. With this looking like a great start I went and tested a couple of bigger numbers.
Bigger Numbers
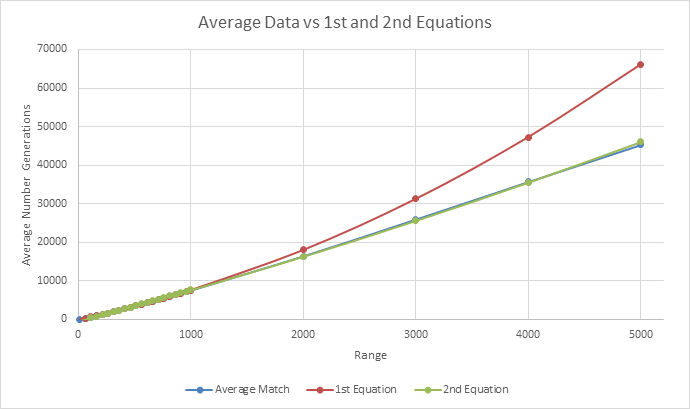
Due to the time to compute these values, I tested with larger numbers that weren't too much bigger than the previously tested numbers. I tested 1000, 2000, 3000, 4000 and 5000 and compared them to the expected value based on the last equation generated.
| Range | Average Number Generations | Expected |
|---|---|---|
| 1000 | 7469.096 | 7549.944 |
| 2000 | 16373.401 | 17996.44 |
| 3000 | 25888.327 | 31242.94 |
| 4000 | 35629.988 | 47289.44 |
| 5000 | 45216.905 | 66135.944 |
Looking at this data, the larger the numbers that were tested, the larger the difference between the actual and expected based on the last equation. After adding this data to the last data gathered and graphing it, the new equation is y = 0.0003x2 + 7.8024x - 470.14 with an R^2 of 0.9997. Even though this R^2 value is good, the lower values tested are far off the expected. An example of this difference for 10 being -33.951 for the last equation and -392.09 for this new equation even though the actual value sits around 29.735. This difference however, starts to decrease when the range is over 200.
Even with this decrease being fixed, I am going to have to generate much larger ranges to have a chance of being able to predict the target value. Unfortunately, this isn't as easy as it seems as the current method is quite slow.
Can Efficiency Be Improved?
My first thought to fix this time issue was "Is my method inefficient?". I ran the method for 1000 runs at a 2000 range using the PyCharm profiler as it ran. The results from the profiler are as follows.
| Name | Call Count | Time (ms) | Own Time (ms) | Own Time % |
|---|---|---|---|---|
| get_generation | 1000 | 282050 | 222018 | 78.71 |
| <method 'sort' of 'list' objects> | 2000000 | 29729 | 29729 | 10.54 |
| randrange | 16247313 | 24371 | 12351 | 4.38 |
| _randbelow | 16247313 | 12019 | 9285 | 3.29 |
| randint | 16247313 | 30102 | 5730 | 2.03 |
| <method 'getrandbits' of '_random.Random' objects> | 16636543 | 1972 | 1972 | 0.70 |
| <method 'bit_length' of 'int' objects> | 16247313 | 762 | 762 | 0.27 |
| <method 'append' of 'list' objects> | 2000000 | 134 | 134 | 0.05 |
| <listcomp> | 1000 | 66 | 66 | 0.02 |
| <module> | 1 | 282072 | 21 | 0.01 |
| <listcomp> | 1 | 0 | 0 | 0.00 |
| <built-in method builtins.print> | 1 | 0 | 0 | 0.00 |
From this we can see that only 21ms was spent outside the get_generation method which is good, nothing is causing efficiency issues in the function called and small calculations. Ignoring the get_generation method as a whole and looking at the smaller bits of it, we can see that the .sort() method used quite a bit of the time. 10.5% of the total execution time was just sorting the list. There is no issue with excessive calling as 2000*1000 is 2,000,000 which is what it's call count was. This shows that it might be ideal to substitute this with an alternative way of saying that the list is full and breaking.
One idea of substitution I had was to sort the list once it had the desired length and then check against the aim variable. After thinking a bit more I realised I didn't even need the sort function. Since I was making sure the random number generated wasn't in the list before inserting it, I can just check its length. If the length is the same as the amount of numbers it is trying to generate, then it can break. This will completely remove the .sort() method and hopefully reduce execution time and speed things up.
Removing .sort()
I changed the get_generation method to get rid of the .sort() list function. This new method removes the need for a target list as it compares the length of the list to the target range. If both are equal this means that we have generated all the values in the range and can break out of the loop. This can be done as the list is checked before a value is added to make sure the value isn't in there.
def get_generation(r):
    generation_count = 0
    generated = []
    while True:
        gen = random.randint(1, r)
        generation_count += 1
        if gen not in generated:
            generated.append(gen)
            if len(generated) == r:
                break
    return generation_count
The new results from the profiler while using this method for 1000 runs at a 2000 range are as follows.
| Name | Call Count | Time (ms) | Own Time (ms) | Own Time % |
|---|---|---|---|---|
| get_generation | 1000 | 308617 | 276438 | 89.56 |
| randrange | 16389852 | 25514 | 13030 | 4.22 |
| _randbelow | 16389852 | 12483 | 9620 | 3.12 |
| randint | 16389852 | 31797 | 6283 | 2.04 |
| <method 'getrandbits' of '_random.Random' objects> | 16783354 | 2073 | 2073 | 0.67 |
| <method 'bit_length' of 'int' objects> | 16389852 | 789 | 789 | 0.26 |
| <built-in method builtins.len> | 2000000 | 162 | 162 | .05 |
| <method 'append' of 'list' objects> | 2000000 | 148 | 148 | 0.05 |
| <listcomp> | 1000 | 69 | 69 | 0.02 |
| <module> | 1 | 308647 | 29 | 0.01 |
| <built-in method builtins.print> | 1 | 0 | 0 | 0.00 |
Even though this method did take longer to run as shown in the <module> time, we have removed bulk of the .sort() method. This execution time increase would have been due to the fact different numbers were generated.
Method to Test
To test the two methods, it would be best to 'pull them apart' and use the exact same numbers on them to see what sort of speed increase there really is. My plan is to generate random numbers in a certain range, make sure all numbers in the range are located in the list and then run them through the two methods. This will mean exactly the same data is being passed through to ensure a fairer test. I created a small script to generate random numbers in a range and stop when all the required numbers are present. I moved this method and created modified versions of the methods I was testing allowing them to take in the new list of numbers only. I then timed the two methods. The script and data are as follows.
import random
import time

def generate_testing_data(r):
    generated = []
    aim = [i for i in range(1, r+1)]
    while True:
        generated.append(random.randint(1, r))
        if all([i in generated for i in aim]):
            break
    return generated

def test_new(r, numbers):
    index = 0
    generated = []
    while True:
        gen = numbers[index]
        index += 1
        if gen not in generated:
            generated.append(gen)
            if len(generated) == r:
                break
    return True

def test_old(r, numbers):
    index = 0
    aim = [i for i in range(1, r + 1)]
    generated = []
    while True:
        gen = numbers[index]
        index += 1
        if gen not in generated:
            generated.append(gen)
            generated.sort()
            if generated == aim:
                break
    return True

for i in range(10):
    r = 1000
    data = generate_testing_data(r)
    start_time = time.time()
    test_old(r, data)
    old_time = time.time() - start_time
    start_time = time.time()
    test_new(r, data)
    new_time = time.time() - start_time
    print (r, "\t", len(data), "\t", old_time, "\t", new_time)
Results
I ran this 16 times and recorded the results. All the ranges are 1000 but due to the generation of random numbers, the lengths will be different.
| Length | Old Method (ms) | New Method(ms) | Difference Gained |
|---|---|---|---|
| 10884 | 0.083470821 | 0.089237928 | -0.005767107 |
| 8740 | 0.06921196 | 0.075702429 | -0.006490469 |
| 8144 | 0.061194181 | 0.06467104 | -0.003476858 |
| 8067 | 0.059659004 | 0.062694788 | -0.003035784 |
| 8031 | 0.059160709 | 0.062134027 | -0.002973318 |
| 7937 | 0.059129238 | 0.061220646 | -0.002091408 |
| 7579 | 0.056650877 | 0.060160398 | -0.003509521 |
| 7572 | 0.055316925 | 0.060691118 | -0.005374193 |
| 7458 | 0.061327457 | 0.063675165 | -0.002347708 |
| 7411 | 0.060157061 | 0.061663151 | -0.00150609 |
| 7273 | 0.054145336 | 0.055227518 | -0.001082182 |
| 7124 | 0.055146694 | 0.057681561 | -0.002534866 |
| 7041 | 0.052210808 | 0.053673506 | -0.001462698 |
| 7018 | 0.052706957 | 0.056149721 | -0.003442764 |
| 5575 | 0.042111397 | 0.043116093 | -0.001004696 |
| 5539 | 0.045147181 | 0.044615984 | 0.000531197 |
| 10884 | 0.083470821 | 0.089237928 | -0.005767107 |
Unfortunately, these results weren't as good as I had hoped. All but one of the differences are negative, meaning this new method increased the time it took to compute the calculations required.
Threading
Since this method didn't speed processing up (and if it did, not by much), I decided to turn to threading. Even with its notorious name in Python, I have done a few projects using python threading. To use threading, I plan to call the get_generation method allowing a certain amount of threads at once (can be changed). When a thread completes, I want to put the data in a list somewhere and when all threads for a range is complete, add the data to a CSV file. This can then be used to look at the data with more depth than previous.
Method
After some quick planning, I completed the new script to how I had planned. Some quick testing and formatting of the CSV output then had it ready to be fully run.
This did in-fact speed up the process of getting the data but threads were not called as fast as expected and it still did have difficulty on higher numbers. To give a bit of feedback I added a method to look at what was running and provide more useful messages. With this output, I noted that threads were peaking at just over 270, this wasn't currently an issue, just interesting. This was the final script for the threading version.
import threading
import random

class Generation_Thread(threading.Thread):

    def __init__(self, range_, return_class, id):
        super(Generation_Thread, self).__init__()
        self.range_ = range_
        self.return_class = return_class
        self.id = id

    def run(self):
        status("Starting " + self.id)
        aim = [i for i in range(1, self.range_ + 1)]
        generation_count = 0
        generated = []
        while True:
            gen = random.randint(1, self.range_)
            generation_count += 1
            if gen not in generated:
                generated.append(gen)
                generated.sort()
                if generated == aim:
                    break
        self.return_class.put(self.range_, generation_count)
        status("Stopping " + self.id)

class ThreadReturn():

    def __init__(self, range_values, runs):
        self.data = {str(i):[] for i in range_values}
        self.runs = runs

    def put(self, range_, generation_count):
        self.data[str(range_)].append(str(generation_count))
        if len(self.data[str(range_)]) >= self.runs:
            self.save(range_)
            status("Saved " + str(range_))

    def save(self, range_):
        f = open('output.csv', 'a')
        f.write(str(range_) + ',' + ','.join(self.data[str(range_)]) + "\n")
        f.close()

def status(message=""):
    active_threads = threading.enumerate()
    thread_data = {}
    for thread in active_threads:
        if not isinstance(thread, Generation_Thread):
            continue
        range_ = thread.id.split("_")[0]
        if range_ not in thread_data:
            thread_data[range_] = 1
        else:
            thread_data[range_] += 1
    print (str(thread_data) + "\t" + message)

runs = 1000
max_threads = 500
range_values = [i for i in range(500, 10001, 500)]

return_class = ThreadReturn(range_values, runs)
threads = {}
for range_value in range_values:
    status("Starting " + str(range_value))
    for i in range(runs):
        while True:
            if threading.active_count() <= max_threads:
                id = str(range_value) + "_" + str(i)
                threads[id] = Generation_Thread(range_value, return_class, id)
                threads[id].start()
                break
    status("Started " + str(range_value))
Results
Once again, the bigger the range, the longer it took to compute. Even with threads, 6000 was a stretch. I decided to bring down the run number to 200 to test some bigger numbers; this will be reflected in the standard error. I understand this will give less accurate data but hopefully, it will be accurate enough to give a reasonable line of best fit.
I compared the threading with the original method but running them both at the same time. Interestingly it wasn't that much faster as the threading had completed when the original method had completed 196/200. I will still use the threading method as it has a better output and gives more information on the current status.
Now having the raw data, I was able to calculate the average, min, max and standard error of each of the samples. Using excel I simply just inserted formulas and then took in the row of data. The data is as follows.
| Range | Runs | Average | Min | Max | Sth. Err. |
|---|---|---|---|---|---|
| 500 | 1000 | 3392.84 | 2049 | 7147 | 21.42 |
| 1000 | 1000 | 7471.59 | 5059 | 13448 | 38.72 |
| 1500 | 1000 | 11852.733 | 8109 | 25614 | 60.39 |
| 2000 | 1000 | 16449.733 | 10935 | 31156 | 84.25 |
| 2500 | 1000 | 20905.963 | 14183 | 34315 | 96.27 |
| 3000 | 1000 | 25500.513 | 17861 | 45517 | 113.56 |
| 3500 | 1000 | 30508.723 | 22411 | 61916 | 137.92 |
| 4000 | 1000 | 35431.821 | 25825 | 63598 | 161.75 |
| 4500 | 1000 | 40217.431 | 28229 | 64413 | 176.81 |
| 5000 | 1000 | 45216.391 | 33309 | 77804 | 200.87 |
| 6000 | 200 | 55676.045 | 42055 | 84056 | 548.92 |
| 7000 | 200 | 66404.76 | 49262 | 109629 | 661.75 |
| 8000 | 200 | 76281.205 | 58873 | 121843 | 740.33 |
| 9000 | 200 | 88607.415 | 68325 | 123956 | 800.37 |
| 10000 | 200 | 98259.72 | 76908 | 182110 | 1012.62 |
| 11000 | 200 | 109195.375 | 84138 | 172973 | 1047.34 |
| 12000 | 200 | 119634.365 | 88378 | 162256 | 989.33 |
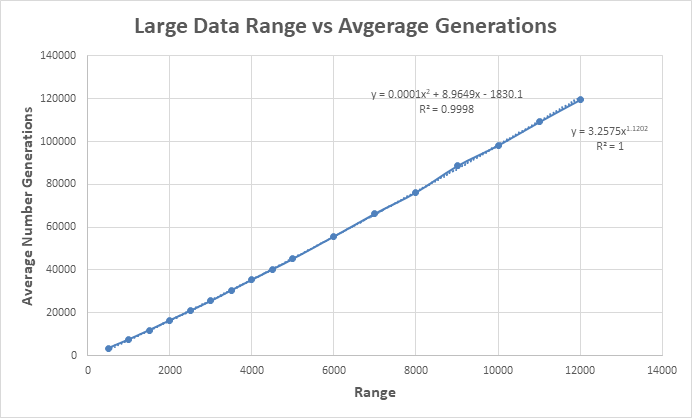
From this data, I discovered that a trendline formula with a power had developed a significant R^2 value and fits visually. I also once again obtained a polynomial function looking similar to the last. These new equations were y = 3.2575x^1.1202 and y = 0.0001x^2 + 8.9649x - 1830.1.
Equation Analysis
I now have four equations being:
- 1st Equation: y = 0.0014x^2 + 6.2465x - 96.556
- 2nd Equation: y = 0.0003x^2 + 7.8024x - 470.14
- Large Data Power: y = 3.2575x^1.1202
- Large Data Polynomial: y = 0.0001x^2 + 8.9649x - 1830.1
With these, I can now take all the data that has been generated and compare it to each of these equations.
| Range | Runs | Average Match | 1st Equation | 2nd Equation | Large Data Power | Large Data Polynomial |
|---|---|---|---|---|---|---|
| 10 | 1000 | 29.7 | -34.0 | -392.1 | -1740.4 | 43.0 |
| 60 | 1000 | 278.4 | 283.3 | -0.9 | -1291.8 | 319.7 |
| 110 | 1000 | 584.6 | 607.5 | 391.7 | -842.8 | 630.5 |
| 160 | 1000 | 910.5 | 938.7 | 785.9 | -393.2 | 959.3 |
| 210 | 1000 | 1240.0 | 1276.9 | 1181.5 | 56.9 | 1300.9 |
| 260 | 1000 | 1618.5 | 1622.2 | 1578.7 | 507.5 | 1652.5 |
| 310 | 1000 | 1953.6 | 1974.4 | 1977.3 | 958.6 | 2012.4 |
| 360 | 1000 | 2355.6 | 2333.6 | 2377.5 | 1410.2 | 2379.3 |
| 410 | 1000 | 2731.2 | 2699.8 | 2779.1 | 1862.3 | 2752.5 |
| 460 | 1000 | 3092.8 | 3073.1 | 3182.3 | 2314.9 | 3131.2 |
| 510 | 1000 | 3482.8 | 3453.3 | 3586.9 | 2768.0 | 3514.8 |
| 560 | 1000 | 3862.0 | 3840.5 | 3993.1 | 3221.6 | 3903.1 |
| 610 | 1000 | 4256.9 | 4234.7 | 4400.7 | 3675.7 | 4295.5 |
| 660 | 1000 | 4669.0 | 4636.0 | 4809.9 | 4130.3 | 4691.8 |
| 710 | 1000 | 5070.3 | 5044.2 | 5220.5 | 4585.4 | 5091.7 |
| 760 | 1000 | 5444.0 | 5459.4 | 5632.7 | 5041.0 | 5495.1 |
| 810 | 1000 | 5868.0 | 5881.6 | 6046.3 | 5497.1 | 5901.6 |
| 860 | 1000 | 6356.6 | 6310.9 | 6461.5 | 5953.7 | 6311.2 |
| 910 | 1000 | 6736.2 | 6747.1 | 6878.1 | 6410.8 | 6723.6 |
| 960 | 1000 | 7147.9 | 7190.3 | 7296.3 | 6868.4 | 7138.8 |
| 1000 | 1000 | 7469.1 | 7549.9 | 7631.9 | 7234.8 | 7472.8 |
| 1500 | 1000 | 11852.7 | 12423.2 | 11907.9 | 11842.3 | 11769.1 |
| 2000 | 1000 | 16373.4 | 17996.4 | 16333.9 | 16499.7 | 16244.2 |
| 2500 | 1000 | 20906.0 | 24269.7 | 20909.9 | 21207.2 | 20857.2 |
| 3000 | 1000 | 25888.3 | 31242.9 | 25635.9 | 25964.6 | 25583.2 |
| 3500 | 1000 | 30508.7 | 38916.2 | 30511.9 | 30772.1 | 30405.3 |
| 4000 | 1000 | 35630.0 | 47289.4 | 35537.9 | 35629.5 | 35311.2 |
| 4500 | 1000 | 40217.4 | 56362.7 | 40713.9 | 40537.0 | 40291.5 |
| 5000 | 1000 | 45216.9 | 66135.9 | 46039.9 | 45494.4 | 45338.9 |
| 6000 | 200 | 55676.0 | 87782.4 | 57141.9 | 55559.3 | 55612.1 |
| 7000 | 200 | 66404.8 | 112228.9 | 68843.9 | 65824.2 | 66094.2 |
| 8000 | 200 | 76281.2 | 139475.4 | 81145.9 | 76289.1 | 76758.4 |
| 9000 | 200 | 88607.4 | 169521.9 | 94047.9 | 86954.0 | 87584.4 |
| 10000 | 200 | 98259.7 | 202368.4 | 107549.9 | 97818.9 | 98556.3 |
| 11000 | 200 | 109195.4 | 238014.9 | 121651.9 | 108883.8 | 109661.1 |
| 12000 | 200 | 119634.4 | 276461.4 | 136353.9 | 120148.7 | 120888.0 |
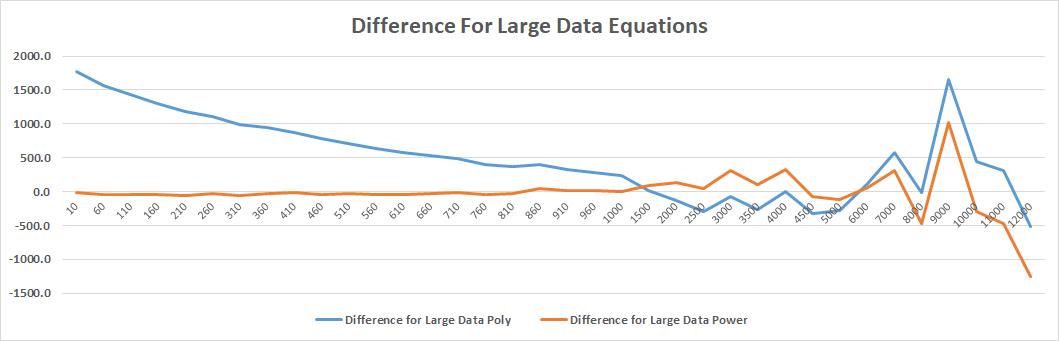
Looking at this table, we can see that the two large data equations have a much better guess to the actual values than the previous two equations. This is because the equations have been formed with more data allowing them to be able to guess larger values more accurately. I will then compare the difference between the average values and the last two equations on a graph.
Conclusion
By looking at the graph, it appears that the large data polynomial equation was the best at predicting the averages. At about 1500 the equations start to be a bit unreliable but are still staying reasonable close being at most 13% in extreme cases away from the average. This would be because I didn't do enough tests to calculate averages and this theory definitely shows when the tests go above a range of 6000 as that is where I only calculated averages based off 200 runs due to the time to run the tests.
Thus, from these tests, I believe the most reliable equation to test the range of 16,777,216 with is y = 0.0001x^2 + 8.9649x - 1830.1.
And then the calculation; y = 0.0001(16777216)^2 + 8.9649(16777216) - 1830.1, y = 28,297,901,904.684002
28 and a quarter billion is still a very big number but a large number was expected. If someone could keep a rate of 400 taps per minute (it would get much slower over time but this is theoretical), it would take them over 134 and a half years to reach this number on average. Even if someone got lucky and had little duplicates compared to an average, I feel this game (Colour) would still not be possible to achieve in anyone's lifetime currently.